Parrot OS · Volume 8
Parrot OS Volume 8 — Wireshark Part 1: Install, Capture, Filters
Architecture, installation on both Windows and Parrot, the GUI walkthrough, capture vs display filters, the BPF and Wireshark-filter cookbooks
8.1 What Wireshark is — history and architecture
Wireshark is the de facto open-source network protocol analyzer. It captures packets off network interfaces, dissects them according to several thousand protocol parsers, and presents them in a navigable GUI with rich filtering, search, and follow-stream capabilities. It also bundles command-line counterparts (tshark, dumpcap, editcap, mergecap, capinfos, text2pcap, randpkt) for scripting and batch work.
8.1.1 Origin
Wireshark started in 1997 as Ethereal, written by Gerald Combs while at the University of Missouri-Kansas City. Combs needed a protocol analyzer that wasn’t $10,000-per-seat commercial software. The project was open source from day one (GPL v2). The original ASCII-only tshark came shortly after, then the GTK-based GUI.
In June 2006 Combs moved to CACE Technologies (a packet-capture company); a trademark issue with the “Ethereal” name forced a rename. The project became Wireshark, the website moved to wireshark.org, and the codebase continued without interruption. The Wireshark Foundation now stewards the project; it remains free and open source under GPL-2.
Major version milestones:
Table 1 — Major version milestones
| Year | Version | What changed |
|---|---|---|
| 1997 | Ethereal 0.1 | Initial release; libpcap-based |
| 2006 | Wireshark 0.99.1 | Rebrand |
| 2008 | 1.0 | First stable; “officially production-ready” |
| 2013 | 1.10 | Big dissector refresh |
| 2014 | 1.12 | tshark JSON output; ssh capture |
| 2015 | 2.0 | Qt GUI (replaces GTK); modern look + macOS native |
| 2019 | 3.0 | Major dissector cleanups; Sequence Analysis improvements |
| 2021 | 3.4 / 3.6 | tshark live capture, USB protocol improvements |
| 2022 | 4.0 | Big rewrite of the display-filter compiler (“modern” filter syntax with backwards compatibility); fewer false negatives; auto-complete |
| 2024 | 4.2 / 4.4 | TLS 1.3 dissection improvements, faster startup |
| 2026 (early) | 4.4.x current | Latest as of this writing |
By 2026 the Qt GUI (introduced in 2.0, mature in 4.x) is the canonical Wireshark experience on every platform.
8.1.2 Architecture
The Wireshark system has clean layer separation:
                ┌────────────────────────────────────────┐
                │ User layer                             │
                │  ┌───────────────┐  ┌──────────────┐   │
                │  │ wireshark     │  │ tshark       │   │
                │  │ (Qt GUI)      │  │ (CLI)        │   │
                │  └───────┬───────┘  └──────┬───────┘   │
                └──────────┼──────────────────┼──────────┘
                           │                  │
                           ▼                  ▼
                ┌────────────────────────────────────────┐
                │ Dissector + display-filter engine      │
                │  - ~3000 protocol dissectors           │
                │  - Display filter compiler             │
                │  - Sequence / TCP / IO / Expert info   │
                └──────────────────────────┬─────────────┘
                                           │
                                           ▼
                ┌────────────────────────────────────────┐
                │ libpcap-style capture layer            │
                │  ┌─────────────────────────────────┐   │
                │  │ dumpcap                         │   │
                │  │  - the actual privileged process │   │
                │  │  - reads packets from interface  │   │
                │  │  - writes to .pcapng file        │   │
                │  │  - applies BPF capture filter    │   │
                │  └──────────────┬──────────────────┘   │
                └─────────────────┼─────────────────────-┘
                                  │
                                  ▼
                ┌────────────────────────────────────────┐
                │ OS packet-capture facility             │
                │  - Linux: libpcap → kernel AF_PACKET   │
                │  - macOS: libpcap → kernel BPF         │
                │  - Windows: WinPcap (legacy) / Npcap   │
                │              (modern) → NDIS LWF       │
                └────────────────────────────────────────┘
Key insight: dumpcap is the privileged process. The Wireshark GUI and tshark are unprivileged — they spawn dumpcap when capture is requested, dumpcap captures to a .pcapng file (or pipes), then the GUI/tshark reads back from the file. This separation is why you can run Wireshark as your normal user without sudo (with proper group membership) — only dumpcap needs elevated privileges, and it’s a tightly-scoped C program.
8.1.3 The file format — pcapng
Wireshark’s native format is pcapng (“PCAP next generation”). The legacy format is pcap. Both are open formats; pcapng is the newer (since 2008-ish), richer one.
Table 2 — 1.3 The file format — pcapng
| Aspect | pcap | pcapng |
|---|---|---|
| Multiple interfaces in one file | No | Yes (per-block interface ID) |
| Per-packet metadata (comments, drops) | No | Yes (annotation blocks) |
| Per-packet capture timestamp precision | µs | ns (nanosecond) |
| Custom blocks for extensions | No | Yes |
| Wireshark default | (legacy) | Yes |
| tcpdump default | Yes (with -w default writes pcap; --pcapng writes pcapng on tcpdump 4.99+) | Available |
The editcap -F pcap / editcap -F pcapng flags convert between formats. Vol 9 § 8 covers when format matters.
8.2 The Wireshark family: dumpcap, tshark, wireshark, editcap, mergecap, capinfos, text2pcap
Eight binaries, one project. Knowing what each does saves arguing with the wrong tool.
Table 3 — 2. The Wireshark family: dumpcap, tshark, wireshark, editcap, mergecap, capinfos, text2pcap {#wireshark-family}
| Binary | Purpose | When |
|---|---|---|
| wireshark | Qt GUI. Live capture + offline analysis. | Interactive analysis. The primary tool. |
| tshark | Text/JSON-output CLI. Live capture + offline analysis. | Scripting, batch processing, headless analysis, remote captures over SSH. |
| dumpcap | Pure capture-to-file. Smallest, most privilege-sensitive binary in the family. | Direct invocation when you want lean capture (e.g., a long ring-buffer capture on a low-resource device). |
| editcap | Modify pcap/pcapng files — slice by time, slice by packet count, convert between formats, anonymize MACs, snaplen-truncate. | Post-capture file manipulation. |
| mergecap | Merge multiple pcap files into one, sorted by timestamp. | Combining captures from multiple interfaces / endpoints. |
| capinfos | Print metadata about a pcap (packet count, duration, encapsulation, capture interfaces). | Quick “what’s in this file?” check before opening. |
| text2pcap | Convert a hex-dump text file back into a pcap (e.g., from a paper bug report). | Recovering captures from text logs. |
| randpkt | Generate random packets of arbitrary types. | Fuzz testing dissectors; never useful in real captures. |
The flow: in interactive use you’ll mostly stay in the GUI. In scripting you’ll invoke tshark for capture-and-filter, editcap for cleanup, mergecap for combining, capinfos for inspection.
8.3 Installing Wireshark on Windows 11
8.3.1 Where to get it
Official download: https://www.wireshark.org/download.html. The Windows installer is a signed .exe (~80-100 MB) — Wireshark-4.4.x-x64.exe (or whatever current at install time). Avoid third-party download sites; the Wireshark binary is a privileged-software target.
8.3.2 The installer screens
- Welcome → Next.
- License Agreement (GPL-2) → I Agree.
- Choose Components — leave defaults checked:
- Wireshark (GUI) ✓
- TShark ✓
- Plugins & Extensions ✓
- Tools (editcap, mergecap, capinfos, text2pcap, randpkt) ✓
- Additional Tasks — checked:
- Create Wireshark desktop icon (preference)
- Associate trace file extensions to Wireshark ✓ (so
.pcapfiles double-click to open)
- Choose Install Location — default
C:\Program Files\Wireshark. - Packet Capture — Wireshark needs a packet-capture driver. Install Npcap.
- Click “Install Npcap [version]” — launches the Npcap installer in a sub-window.
- Npcap options: Install Npcap in WinPcap API-Compatible Mode (enable for backwards compat with old tools that expect WinPcap), Support raw 802.11 traffic (enable — required for Wi-Fi monitor mode if your card supports it on Windows), Support loopback traffic (enable — captures localhost), Install Npcap service (enable). Accept defaults if uncertain.
- Npcap installs. Returns to Wireshark installer.
- USB Capture — install USBPcap to capture USB traffic on Windows (Vol 9 § 6). Useful, low overhead — recommend installing.
- Install → progress → Finish.
8.3.3 Npcap is the modern capture driver
A historical note worth knowing: the original Windows packet capture library was WinPcap, ported from libpcap in 1999, deprecated in 2018. Npcap (also from Nmap Project, Insecure.com LLC) replaced it — fully modern, supports newer Windows versions, supports raw 802.11 and loopback. Npcap is the current capture driver on Windows in 2026. Old tutorials referring to WinPcap should be read as referring to Npcap.
8.3.4 First-launch privileges
To capture packets on Windows, the Wireshark process needs to access Npcap’s NDIS Lightweight Filter, which requires elevated privileges. Two options:
Option A — run Wireshark as Administrator: right-click the Wireshark icon → Run as administrator. The Capture menu enables.
Option B — grant your user permission to use Npcap without admin: open services.msc → find “Npcap Packet Driver (NPCAP)” → ensure it’s “Running” and set to “Automatic” startup. Then in Wireshark → Edit → Preferences → Capture → set “Default interface” if Wireshark won’t show interfaces under your user. If still no interfaces, run the Npcap installer again and select the option “Restrict Npcap driver’s access to Administrators only” → uncheck. Reboot. This permits non-elevated processes to access the capture driver.
Option A is fine for interactive use; Option B is the right setup for daily-driver / non-admin Windows accounts.
8.3.5 Verifying the install
Open Wireshark. The Welcome screen should list capture interfaces (your Ethernet adapter, Wi-Fi adapter, any virtual adapters). Double-click an interface → live capture starts → traffic streams in the packet list. If interfaces are empty: capture-driver problem (re-run Npcap installer per § 3.4).
From PowerShell:
& "C:\Program Files\Wireshark\tshark.exe" -D
# Lists capture interfaces. If empty, capture driver isn't installed/loaded.

& "C:\Program Files\Wireshark\tshark.exe" --version
8.4 Installing Wireshark on Parrot OS
8.4.1 Pre-installed by default
Parrot Security Edition ships Wireshark via the parrot-tools-sniffer and parrot-tools-wireless metapackages. If you installed from the Security ISO, Wireshark is already there:
which wireshark tshark dumpcap
# Should show /usr/bin/wireshark, /usr/bin/tshark, /usr/bin/dumpcap

wireshark --version
If somehow not installed (Home Edition, or you removed parrot-tools-sniffer):
sudo apt install wireshark wireshark-qt tsharkThe install prompts: “Should non-superusers be able to capture packets?” — answer Yes. This creates a wireshark group; users in that group can run dumpcap without sudo. § 5 covers the details.
8.4.2 Add your user to the wireshark group
sudo usermod -aG wireshark $USER
# Log out + back in for group change to take effect.
# Or:
newgrp wireshark
Verify:
groups | grep wireshark8.4.3 Launching
From MATE menu → Internet → Wireshark (or Pentesting → Sniffing & Spoofing → Wireshark).
Or from terminal: wireshark &.
The Welcome screen shows all capture-capable interfaces (eth0, wlan0, lo, any, plus Bluetooth and USB if available).
8.5 Capture privileges — the dumpcap group trick on Linux
8.5.1 Why this matters
Capturing raw packets on Linux requires CAP_NET_RAW and CAP_NET_ADMIN capabilities. By default these belong to root. The naive solution — sudo wireshark — runs the entire Wireshark GUI as root, which is a security nightmare: Wireshark is a complex Qt application loading thousands of dissectors written in C, every one a potential parser-bug arbitrary-code-execution target. Running it as root means a malformed packet can compromise the whole system.
The right approach: grant capture capabilities to dumpcap only, and let dumpcap drop those capabilities after starting. The Wireshark GUI then runs as your normal user, only the privileged-but-tiny dumpcap process touches raw sockets.
8.5.2 How the dumpcap group works
Parrot’s Wireshark package configures this automatically when you answer “Yes” to the post-install prompt. The mechanism:
# Verify dumpcap's capabilities
getcap /usr/bin/dumpcap
# Should output: /usr/bin/dumpcap cap_net_admin,cap_net_raw=eip

# Verify the binary's group
ls -l /usr/bin/dumpcap
# -rwxr-xr-- 1 root wireshark ...

# Only members of the wireshark group can execute dumpcap.
# Capabilities + group membership = capture works without sudo.
If for some reason this isn’t set up:
sudo dpkg-reconfigure wireshark-common
# Answer "Yes" to "Should non-superusers be able to capture packets?"
sudo usermod -aG wireshark $USER
# Log out + back in
Manually:
sudo setcap cap_net_admin,cap_net_raw+eip /usr/bin/dumpcap
sudo chown root:wireshark /usr/bin/dumpcap
sudo chmod 750 /usr/bin/dumpcap
sudo usermod -aG wireshark $USER
8.5.3 Verifying
After the above + re-login:
dumpcap -D
# Lists interfaces. Should NOT error with "permission denied."

dumpcap -i eth0 -c 10 -w /tmp/test.pcap
capinfos /tmp/test.pcap
If dumpcap -D fails with permission denied, check getcap /usr/bin/dumpcap (should show the capabilities) and groups | grep wireshark (should show membership).
8.6 The Wireshark GUI — every pane explained
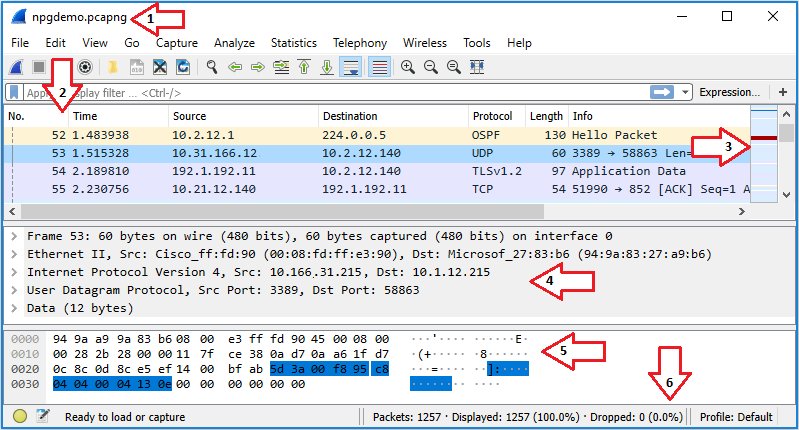
Open Wireshark. The screen has four primary regions after a capture starts:
┌─────────────────────────────────────────────────────────────────────────────────────┐
│ File  Edit  View  Go  Capture  Analyze  Statistics  Telephony  Wireless  Tools  ... │ Menu bar
├─────────────────────────────────────────────────────────────────────────────────────┤
│ [▶][⏹][🔄][💾][▼] [≡][🔍] | [ ←  → ] | [filter: ip.addr == 10.0.0.1 ▼]    [Apply]   │ Toolbar
├─────────────────────────────────────────────────────────────────────────────────────┤
│ No.   Time      Source       Destination     Protocol  Length  Info                 │
│ 1     0.000000  10.0.0.5     10.0.0.1        TCP       66      52341 → 80 [SYN]    │
│ 2     0.000234  10.0.0.1     10.0.0.5        TCP       66      80 → 52341 [SYN,ACK]│ Packet list
│ 3     0.000401  10.0.0.5     10.0.0.1        TCP       58      52341 → 80 [ACK]    │
│ 4     0.001123  10.0.0.5     10.0.0.1        HTTP      378     GET / HTTP/1.1      │
│ ...                                                                                 │
├─────────────────────────────────────────────────────────────────────────────────────┤
│ ▶ Frame 4: 378 bytes on wire (3024 bits), 378 bytes captured...                     │
│ ▶ Ethernet II, Src: 00:11:22:33:44:55, Dst: aa:bb:cc:dd:ee:ff                       │
│ ▶ Internet Protocol Version 4, Src: 10.0.0.5, Dst: 10.0.0.1                         │ Packet details
│ ▶ Transmission Control Protocol, Src Port: 52341, Dst Port: 80                      │
│ ▶ Hypertext Transfer Protocol                                                       │
├─────────────────────────────────────────────────────────────────────────────────────┤
│ 0000 aa bb cc dd ee ff 00 11 22 33 44 55 08 00 45 00  ........ "3DU..E.            │
│ 0010 01 6c 12 34 40 00 40 06 ...                       .l.4@.@.                    │ Packet bytes
├─────────────────────────────────────────────────────────────────────────────────────┤
│ Packets: 1234 · Displayed: 1234 (100%) · Loaded: 1234 · Dropped: 0  | Profile: Def │ Status bar
└─────────────────────────────────────────────────────────────────────────────────────┘
8.6.1 Menu bar
The functions you’ll actually use:
Table 4 — The functions you'll actually use
| Menu | Items that matter |
|---|---|
| File | Open, Open Recent, Save / Save As, Export Packet Dissections (CSV/JSON/PSML/PDML), Export Objects (HTTP/SMB/TFTP — extract files from streams) |
| Edit | Find Packet, Mark/Unmark Packet, Time Reference, Preferences (huge — protocol tuning, name resolution, columns, dissector enables) |
| View | Show / Hide pane, Coloring Rules, Time Display Format (UTC, seconds since first packet, etc.), Show as 32-bit (network byte order), Reload Lua plugins |
| Go | First/Previous/Next/Last packet, Go to Packet (number), Next conversation packet |
| Capture | Options (interface, filter, file output), Start (Ctrl+E), Stop (Ctrl+E again), Restart, Refresh Interfaces, Capture Filters (manage saved BPF filters) |
| Analyze | Display Filters (manage saved display filters), Display Filter Expression (builder), Follow → TCP / UDP / TLS / HTTP Stream, Decode As (force-interpret a port as a different protocol), Enabled Protocols (turn off noisy dissectors) |
| Statistics | Capture File Properties, Resolved Addresses, Protocol Hierarchy, Conversations (top talkers), Endpoints (per-host stats), Packet Lengths, IO Graph, Service Response Time, TCP Stream Graph, HTTP / DNS / DHCP, WLAN Traffic |
| Telephony | RTP, SIP, VoIP Calls, IAX2 — only relevant for voice work |
| Wireless | Bluetooth ATT / Bluetooth Devices, WLAN Traffic (per-AP stats from monitor-mode capture) |
| Tools | Firewall ACL Rules (auto-generates iptables / Cisco ACL from selected packet), Lua console |
| Help | Sample Captures (pre-recorded pcaps to play with), About |
8.6.2 Toolbar
- ▶ / ⏹ — Start / Stop capture.
- 🔄 — Restart capture (clear + start).
- 💾 — Save current capture.
- 🔍 — Find packet (text or hex search within the current capture).
- Filter bar — display-filter expression. Type, press Enter or click Apply; only matching packets are shown.
The filter bar has autocomplete and syntax highlighting in 4.x — invalid filter syntax turns the bar red. Click the bookmark icon at the left of the filter bar to save / load named filters.
8.6.3 Packet list pane
Each row = one packet (or one frame, in 802.11 monitor mode). Columns:
- No. — packet number in the capture file, starting at 1.
- Time — by default, seconds since the first packet. Change in View → Time Display Format.
- Source / Destination — IP addresses (or MAC, or hostname if name resolution enabled).
- Protocol — highest-level protocol parser that hit. “HTTP” wins over “TCP” wins over “IP.”
- Length — bytes on wire.
- Info — protocol-specific summary. For TCP: ports + flags. For HTTP: method + URL. For DNS: query name. Excellent at-a-glance triage.
Coloring rules (default 19 of them) tint each row by protocol/flag pattern — bright red for bad TCP (retransmission, out-of-order), green for HTTP, blue for DNS. Customize via View → Coloring Rules.
8.6.4 Packet details pane
A tree view of the dissected packet. Each layer is a foldable node:
- Frame: capture-time metadata (timestamp, interface, frame length).
- Ethernet: Src/Dst MAC, EtherType.
- IP: Src/Dst IP, TTL, IPID, flags, options.
- TCP: ports, sequence/ack numbers, flags, window, checksum, options (MSS, SACK, TSval).
- Application protocol (HTTP, TLS, etc.): fields parsed by the relevant dissector.
Expand a layer → see fields. Click a field → corresponding bytes highlighted in the bytes pane. Right-click a field → many useful actions:
- Apply as Filter → Selected — adds the field to the current display filter as
==. - Apply as Filter → Not Selected — adds with
!=. - Prepare a Filter — same but doesn’t apply; lets you edit first.
- Follow → TCP/UDP/TLS Stream — extract the application-layer payload of this conversation.
- Conversation Filter — filter to packets in the same TCP/UDP conversation.
- Copy → Field Name / Field Value / Value as Hex/Bytes/Binary/Decimal.
- Wiki Protocol Page — opens wireshark.org wiki for the protocol.
8.6.5 Packet bytes pane
Raw hex dump + ASCII. Clicking a field in the details pane highlights the bytes; clicking bytes highlights the field. Right-click → Show packet bytes in popup (zoom view), Show packet in new window. In 4.x, multiple selection bytes can be copied as hex string for paste into other tools.
8.6.6 Status bar
- Packets — total in the capture file.
- Displayed — packets matching the current display filter.
- Loaded — currently loaded into the GUI’s working set.
- Dropped — packets the kernel dropped before capture (the bad number — see Vol 9 § 4).
- Profile — current display profile (alternate configurations: column sets, coloring rules, preferences). Default + Bluetooth + Classic + Wireless are common.
8.7 Capture interfaces — what they are and what they show
8.7.1 Standard interfaces
Table 5 — 7.1 Standard interfaces
| Interface | What it captures | OS |
|---|---|---|
eth0, enp0s31f6 | Wired Ethernet on the laptop | Linux |
wlan0, wlp61s0 | Wi-Fi adapter (managed mode — captures only frames addressed to/from this host) | Linux |
wlan0mon, wlx*mon | Wi-Fi in monitor mode (captures ALL 802.11 frames on the channel) | Linux |
lo | Loopback (127.0.0.1 traffic) | Linux + Win |
any | All interfaces simultaneously (loopback included) | Linux |
bluetooth0, bluetooth1 | Bluetooth HCI capture | Linux + Win (with btatt plugin) |
usbmon0, usbmon1 | USB raw capture (requires modprobe usbmon) | Linux |
Ethernet, Wi-Fi | Windows-named interfaces (friendly name from Network Connections) | Win |
Loopback | Windows loopback (Npcap “Support loopback traffic” option) | Win |
USBPcap1 | Windows USB capture (USBPcap component) | Win |
8.7.2 Monitor mode vs managed mode (Wi-Fi)
A Wi-Fi adapter in managed mode (the default) talks 802.11 like a normal client — associates with an AP, only sees frames addressed to its own MAC or broadcast/multicast. Wireshark capture on a managed interface mostly sees Ethernet-equivalent traffic; 802.11 metadata is stripped.
A Wi-Fi adapter in monitor mode stops associating, tunes to a specific 802.11 channel, and captures every 802.11 frame on that channel — beacons, probes, deauths, data frames from any nearby AP/client. The captures include full 802.11 headers (with Radiotap metadata: signal strength, channel, MCS) but the data frames are usually encrypted (WPA2 / WPA3).
Switching to monitor mode on Parrot:
# Identify the Wi-Fi interface name
ip link show
# wlan0 (or wlp61s0 etc.)

# Stop NetworkManager from owning it
sudo nmcli device set wlan0 managed no

# Bring down, set mode, bring up
sudo ip link set wlan0 down
sudo iw dev wlan0 set type monitor
sudo ip link set wlan0 up

# Set channel
sudo iw dev wlan0 set channel 6

# In Wireshark, capture from wlan0 — now sees raw 802.11.
Or use the higher-level airmon-ng:
sudo airmon-ng check kill              # kill processes that interfere
sudo airmon-ng start wlan0             # creates wlan0mon
# Capture from wlan0mon in Wireshark.
sudo airmon-ng stop wlan0mon # restore managed modeCritical: not every Wi-Fi card supports monitor mode reliably. The T480’s stock Intel 8265 has limited monitor support (works for capture, hit-or-miss for injection). The Vol 2 § 3.4 upgrade to AX200/AX210 helps. External USB Wi-Fi cards (Alfa AWUS036ACS, TP-Link TL-WN722N v1) have rock-solid monitor + injection.
8.7.3 USB capture
sudo modprobe usbmon on Linux exposes /dev/usbmon0 through /dev/usbmonN (one per USB bus). Wireshark sees them as usbmon0, usbmon1, etc. Captures every USB transfer on that bus — Setup, Data In, Data Out, Status — including HID keypresses if a USB keyboard is plugged in. Vol 9 § 6 covers analysis.
8.7.4 Loopback capture
Captures traffic on the local loopback (127.0.0.1, ::1). Useful when debugging a service that talks to itself (web app calling its own API, two local containers via 127.0.0.1).
On Linux: lo interface. On Windows: enabled by Npcap’s “Support loopback traffic” install option; appears as a capture interface.
8.7.5 The any interface (Linux only)
any captures from all interfaces. Cheap way to grab everything without picking one — but you can’t see which interface each packet came from in the packet list (the metadata is there, but not in default columns).
8.8 Capture filters (BPF) vs display filters (Wireshark syntax)
Two filter systems. They look similar in casual use, but they are fundamentally different mechanisms with different syntax and different goals. Confusing them is the #1 newbie mistake.
Table 6 — 8. Capture filters (BPF) vs display filters (Wireshark syntax) {#filters-vs-filters}
| Capture filter | Display filter | |
|---|---|---|
| When applied | At capture time, in dumpcap | At display time, after capture |
| Language | BPF (Berkeley Packet Filter) | Wireshark’s own filter language |
| Syntax style | Concise, primitive-based: tcp port 80 | Field-name-based: tcp.port == 80 |
| Effect | Packets that don’t match are NEVER captured. Gone. | Packets that don’t match are hidden but still in the file. |
| Field knowledge | Limited — only headers visible to BPF (Ethernet, IP, TCP, UDP, ICMP basics) | Full — every dissected field from every dissector |
| Where set in GUI | Capture → Options → Capture filter | Filter bar at top |
| Where set in CLI | dumpcap -f / tshark -f | tshark -Y |
| Performance | Very fast (kernel-level on Linux) | Slower (post-dissection) |
| Reversibility | Filtered-out packets are lost | Filter removable; all packets remain |
Rule of thumb:
- Capture filter when the volume of traffic is huge and you only need a slice. e.g., capturing on a busy 1 Gbps link → use
host 10.0.0.5 and tcp port 443to limit at capture time. - Display filter for analysis. Capture everything; filter the view.
- Both when appropriate — capture filter to limit to a host/protocol, display filter to drill into specific fields.
8.8.1 Why the syntaxes differ
BPF was developed for tcpdump in the early 90s (McCanne and Jacobson, USENIX Winter 1993). It’s a kernel-evaluable bytecode language — every BPF expression compiles to a tiny bytecode program that the kernel runs on each packet before delivering it to userspace. The constraint is that BPF runs before dissection — it sees the raw bytes, knows only what offset Ethernet / IP / TCP headers live at, can’t peek into application layers. Hence BPF can ask “TCP port 80?” but cannot ask “HTTP method GET?”
Wireshark’s display filter language was developed later, post-dissection. By the time the filter runs, the packet is fully dissected — Wireshark knows that the bytes at offset 54 are an HTTP request line, that the URI is “/admin”, that the User-Agent is “curl/7.81.0”. The filter language exposes all those fields by name.
8.9 The BPF capture-filter cookbook
Common BPF patterns. Used in Wireshark’s capture-filter box, in dumpcap -f, in tshark -f, in tcpdump.
8.9.1 Hosts and addresses
Table 7 — 9.1 Hosts and addresses
| Filter | Matches |
|---|---|
host 10.0.0.5 | Packets to or from 10.0.0.5 |
src host 10.0.0.5 | Packets from 10.0.0.5 |
dst host 10.0.0.5 | Packets to 10.0.0.5 |
host example.com | Resolves once at capture start, then numeric match |
host 2001:db8::1 | IPv6 |
net 10.0.0.0/24 | Packets to/from any host in the subnet |
src net 192.168.1.0/24 | Packets sourced from the subnet |
not host 10.0.0.5 | Everything except 10.0.0.5 |
host 10.0.0.5 and host 10.0.0.6 | Conversations between these two |
8.9.2 Ports and protocols
Table 8 — 9.2 Ports and protocols
| Filter | Matches |
|---|---|
port 80 | TCP or UDP port 80, source or destination |
tcp port 80 | TCP port 80 only |
udp port 53 | UDP port 53 |
src port 80 | Source port 80 (server-side response, typically) |
dst port 443 | Destination port 443 (client requests, typically) |
portrange 20-25 | Source or dest in range |
tcp portrange 8000-8999 | TCP only, source or dest in range |
tcp | All TCP |
udp | All UDP |
icmp | All ICMP |
arp | All ARP |
not arp and not icmp and not udp port 5353 | Common noise filter (remove mDNS) |
8.9.3 Boolean composition
Table 9 — 9.3 Boolean composition
| Operator | Aliases |
|---|---|
and, && | Both conditions match |
or, ` | |
not, ! | Negation |
| Parentheses | Grouping. Required when mixing or-and: (host A or host B) and port 80. |
8.9.4 TCP flags
The classic capture-filter SYN-without-ACK detector (find connection initiations):
tcp[tcpflags] & tcp-syn != 0 and tcp[tcpflags] & tcp-ack = 0Or shorthand:
tcp[13] & 2 != 0 and tcp[13] & 16 = 0(Byte 13 of the TCP header is the flags byte; bit 2 = SYN, bit 16 = ACK.)
8.9.5 Wireless capture filters
When capturing in monitor mode, the link-layer is 802.11 (not Ethernet). BPF gains 802.11 primitives:
type mgt subtype beacon          # 802.11 beacons
type mgt subtype probe-req       # probe requests
type mgt subtype probe-resp      # probe responses
type mgt subtype deauth          # deauth frames
type mgt subtype disassoc        # disassociation frames
type data                        # data frames (encrypted under WPA2 unless decrypted)
type ctl                         # control frames (ACK, RTS, CTS)
wlan addr2 00:11:22:33:44:55     # frames sourced from this MAC
wlan addr1 00:11:22:33:44:55     # frames addressed to this MAC
8.9.6 USB capture filters
usb.bus_id == 1                  # only bus 1
usb.endpoint_address == 0x83     # specific endpoint
(Note: this is technically a Wireshark display filter on USB captures, but usbmon capture filters use similar field names since dumpcap on usbmon understands the format.)
8.10 The Wireshark display-filter cookbook
The big one. Display filters work post-dissection on the fields the dissector identified.
8.10.1 Syntax basics
- Equality:
field == value.==andeqare synonyms. - Inequality:
field != valueorfield ne value. - Comparison:
<,<=,>,>=(orlt,le,gt,ge). - Contains:
field contains "value"— substring match on a string. - Matches:
field matches "regex"— PCRE regex match. - Negation:
!fieldornot field. - Boolean:
and,or,not,&&,||,!, parentheses. - Existence:
tcp(matches every packet that has a TCP layer);!arp(every packet that doesn’t have ARP).
Field names are hierarchical (tcp.port, http.request.method, tls.handshake.type). The full field list is huge; the easiest way to find a field name is:
- Capture some traffic of the protocol you’re interested in.
- Click a packet of that type.
- Expand the relevant layer in the details pane.
- Click the field whose name you want.
- The field name appears at the bottom-left of the status bar. e.g.,
tcp.flags.syn. - Right-click → “Apply as Filter → Selected” auto-types the field == value into the filter bar.
8.10.2 The 50-pattern cookbook
Table 10 — 10.2 The 50-pattern cookbook
| Goal | Filter |
|---|---|
| IP host (either direction) | ip.addr == 10.0.0.5 |
| IP source | ip.src == 10.0.0.5 |
| IP destination | ip.dst == 10.0.0.5 |
| Subnet | ip.addr == 10.0.0.0/24 |
| IPv6 host | ipv6.addr == 2001:db8::1 |
| TCP port | tcp.port == 80 |
| TCP source port | tcp.srcport == 80 |
| TCP dest port | tcp.dstport == 443 |
| UDP port | udp.port == 53 |
| Either TCP or UDP port (any) | tcp.port == 80 or udp.port == 80 |
| TCP SYN only | tcp.flags.syn == 1 and tcp.flags.ack == 0 |
| TCP SYN-ACK | tcp.flags.syn == 1 and tcp.flags.ack == 1 |
| TCP RST | tcp.flags.reset == 1 |
| TCP retransmissions | tcp.analysis.retransmission |
| TCP duplicate ACKs | tcp.analysis.duplicate_ack |
| TCP out-of-order | tcp.analysis.out_of_order |
| TCP zero window | tcp.analysis.zero_window |
| HTTP requests | http.request |
| HTTP responses | http.response |
| HTTP GET only | http.request.method == "GET" |
| HTTP POST only | http.request.method == "POST" |
| HTTP user-agent contains “curl” | http.user_agent contains "curl" |
| HTTP URI matches regex | http.request.uri matches "/admin/.*" |
| HTTP status 200 | http.response.code == 200 |
| HTTP status 4xx | http.response.code >= 400 and http.response.code < 500 |
| HTTP host header | http.host == "example.com" |
| HTTP cookie present | http.cookie |
| DNS queries | dns.flags.response == 0 |
| DNS responses | dns.flags.response == 1 |
| DNS name | dns.qry.name == "example.com" |
| DNS name contains | dns.qry.name contains "google" |
| DNS A record query | dns.qry.type == 1 |
| DNS AAAA query | dns.qry.type == 28 |
| DHCP | dhcp or bootp |
| DHCP Discover | dhcp.option.dhcp == 1 |
| ARP requests | arp.opcode == 1 |
| ARP replies | arp.opcode == 2 |
| ARP gratuitous | arp.opcode == 1 and arp.src.proto_ipv4 == arp.dst.proto_ipv4 |
| ICMP echo request (ping) | icmp.type == 8 |
| ICMP echo reply | icmp.type == 0 |
| ICMP destination unreachable | icmp.type == 3 |
| TLS handshake (any) | tls.handshake.type |
| TLS ClientHello | tls.handshake.type == 1 |
| TLS ServerHello | tls.handshake.type == 2 |
| TLS certificate | tls.handshake.type == 11 |
| TLS application data | tls.record.content_type == 23 |
| TLS SNI contains | tls.handshake.extensions_server_name contains "example" |
| Frame size > 1500 | frame.len > 1500 |
| Captured > N seconds ago | frame.time_relative > 60 |
| Specific MAC source | eth.src == 00:11:22:33:44:55 |
| Specific MAC dst | eth.dst == 00:11:22:33:44:55 |
| 802.11 beacons | wlan.fc.type_subtype == 0x08 |
| 802.11 deauth | wlan.fc.type_subtype == 0x0c |
| 802.11 specific SSID in beacon | wlan.ssid == "TargetNetwork" |
| Bluetooth GATT read | btatt.opcode == 0x0a |
| Packet on USB bus 2 | usb.bus_id == 2 |
| USB HID keypress | usbhid.data (then look at the bytes) |
| Specific source + protocol | ip.src == 10.0.0.5 and http |
| All errors | expert.severity == "Error" |
| ICMP unreachable from gateway | icmp.type == 3 and ip.src == 10.0.0.1 |
| Non-secure HTTP | http and not tls |
8.10.3 Saving filters
Filter bar → bookmark icon → Manage Display Filters → Add. Named filters save under your Wireshark profile (default profile: ~/.config/wireshark/dfilters).
8.11 Ring buffer captures (rotating files)
For long-running passive captures (overnight monitoring, multi-day forensic capture), a single growing file is the wrong shape — it’ll be hundreds of GB and unopenable. Ring buffers solve this: write N files of M MB / minutes / packets each, rotate, oldest gets overwritten.
8.11.1 GUI
Capture → Options → Output tab:
- Capture file:
/var/log/captures/eng-%Y%m%d-%H%M%S.pcap(date-stamped per file) - Use multiple files: ✓
- Next file every: 100 MB (or 5 minutes — either trigger creates a new file)
- Use a ring buffer with: 50 files (keeps last 50 files, oldest auto-deleted)
Total disk: 50 × 100 MB = 5 GB rolling window. When file 51 is created, file 1 is unlinked.
8.11.2 CLI (dumpcap directly)
sudo dumpcap -i eth0 -b filesize:102400 -b files:50 -w /var/log/captures/eng.pcap
# -b filesize:N (KB per file)
# -b files:N (ring buffer of N files)
# -b duration:N (seconds per file)
8.11.3 CLI (tshark)
tshark -i eth0 -b filesize:102400 -b files:50 -w /var/log/captures/eng.pcap8.12 Saving, slicing, merging pcaps — editcap and mergecap
8.12.1 editcap
editcap is the swiss army knife for modifying pcap files.
Table 11 — 12.1 editcap
| Task | Command |
|---|---|
| Save first N packets | editcap -c N in.pcap out.pcap |
| Slice by time range | editcap -A "2026-05-15 12:00:00" -B "2026-05-15 13:00:00" in.pcap out.pcap |
| Truncate to snaplen (privacy: cut payloads) | editcap -s 96 in.pcap out.pcap (keeps first 96 bytes of each packet — headers only) |
| Convert pcap → pcapng | editcap -F pcapng in.pcap out.pcapng |
| Convert pcapng → pcap | editcap -F pcap in.pcapng out.pcap |
| Split into chunks | editcap -c 10000 in.pcap chunk.pcap (creates chunk_00000.pcap, chunk_00001.pcap, …) |
| Add a packet comment | editcap --capture-comment "Engagement: Acme; analyst: <analyst>" in.pcap out.pcap |
| Strip duplicates | editcap -d in.pcap out.pcap |
| Adjust timestamps (e.g., timezone) | editcap -t -25200 in.pcap out.pcap (shifts -7 hours = 25200 seconds back) |
| Anonymize IP addresses | editcap --replace 10.0.0.1 192.168.1.1 in.pcap out.pcap (single substitution; for full anonymization use tcprewrite or pcapsanitize) |
8.12.2 mergecap
# Merge by timestamp (default)
mergecap -w combined.pcap capture1.pcap capture2.pcap capture3.pcap

# Append (in argument order, regardless of timestamps)
mergecap -a -w combined.pcap capture1.pcap capture2.pcap

# Specify output format
mergecap -F pcapng -w combined.pcapng cap*.pcap
8.12.3 capinfos
capinfos capture.pcap
# Shows: file type, file size, number of packets, packet rate, capture duration,
# data byte total, start and end times, encapsulation type, interfaces.
For programmatic use:
capinfos -M -c -d capture.pcap # machine-readable, packet count, average data rate8.13 Cheatsheet additions
- Wireshark install Windows: Wireshark + Npcap from https://www.wireshark.org. Enable “Support loopback traffic” in Npcap install.
- Wireshark install Parrot: pre-installed via
parrot-tools-sniffer. Add user:sudo usermod -aG wireshark $USER; relogin. - dumpcap capabilities:
getcap /usr/bin/dumpcapshould showcap_net_admin,cap_net_raw=eip. - Capture filter vs display filter: capture = BPF, applied at capture time, lossy. Display = Wireshark syntax, applied after capture, reversible.
- Top capture filters:
host X,tcp port N,udp port N,not arp and not icmp,tcp[tcpflags] & tcp-syn != 0. - Top display filters:
ip.addr == X,tcp.port == N,http.request.method == "GET",tcp.flags.reset == 1,dns.qry.name contains "X". - Wi-Fi monitor mode Parrot:
sudo airmon-ng start wlan0→ captures from wlan0mon. - USB capture Linux:
sudo modprobe usbmon→ captures fromusbmonN. - Loopback capture Windows: requires Npcap “Support loopback traffic” install option.
- Ring buffer:
dumpcap -i eth0 -b filesize:102400 -b files:50 -w eng.pcap. - Slice pcap by count:
editcap -c N in.pcap out.pcap. - Slice pcap by time:
editcap -A start -B end in.pcap out.pcap. - Merge pcaps:
mergecap -w combined.pcap *.pcap. - Pcap metadata:
capinfos capture.pcap. - Find field name in GUI: click field in details pane; field name shows at status bar bottom-left.
Comments (0)